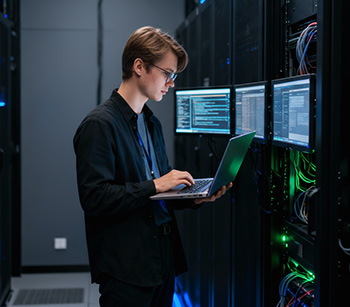
A smooth and seamless user experience (DEM – Digital Experience Monitoring) is the backbone of any successful business. It is no longer enough for servers to be operational; what is crucial is to understand how that infrastructure, in its entirety, impacts the productivity and satisfaction of those who use it. Grafana, recognized for its versatility in data visualization, becomes an indispensable tool for moving beyond basic infrastructure metrics and into the realm of DEM.

Why is DEM fundamental to your IT strategy?
Traditionally, IT monitoring has focused on isolated components: CPU, memory, disk space or bandwidth usage. While this information is vital, it provides a fragmented view of the picture. The true power of Grafana lies in its ability to consolidate data from multiple sources, building a complete narrative of the digital experience:
- Application Performance (APM): We analyze how your applications behave from the user’s perspective.
- Browser experience: We monitor load times, script errors and user interaction directly from the browser.
- Logs and errors: We correlate system errors with the direct impact on usability.
- Availability of critical services: We ensure that business-critical services are always accessible.
This consolidation allows you to move beyond fault detection to a holistic understanding of how the infrastructure influences the end user.
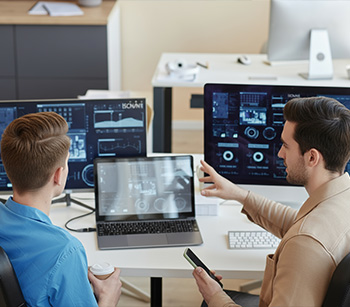
Transforming data into actions with Grafana
Imagine being able to visualize in a single dashboard how latency in a specific database translates directly into increased load time for a crucial web page, or how a spike in errors in a microservice negatively impacts a user’s ability to complete a transaction. Grafana facilitates this complex data correlation, turning cold numbers into actionable information that improves decision making and streamlines incident resolution.
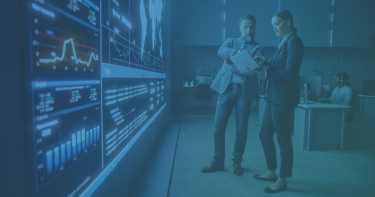
By adopting a DEM approach with Grafana, your company not only guarantees the robustness and optimal performance of your infrastructure, but also ensures maximum satisfaction and efficiency of your end users. At ToBeIT, we guide you in the implementation of Grafana solutions that will allow you to have a complete view of your digital environment and act proactively.
For user experience monitoring that truly makes a difference, explore the capabilities of Grafana and observability with ToBeIT on our dedicated page. Discover how our experience with Grafana’s Grafana observability software observability software can transform the way your organization understands and improves the digital experience, ensuring optimal performance and full satisfaction for all users.